PDF स्टेटमेंट अपलोड करें और एक्सट्रैक्शन को लाइव होते देखें। तुरंत प्रीव्यू, साइनअप की ज़रूरत नहीं।
- GDPR अनुरूप
- Excel/CSV एक्सपोर्ट करें
- सुरक्षित डेटा
अपनी PDF फ़ाइलें यहां ड्रैग और ड्रॉप करें, या चुनने के लिए क्लिक करें
1 फ़ाइल · अधिकतम 100 पेज · 2 पेज का फ्री प्रीव्यू
भारतीय स्टेट बैंक
स्टेटमेंट — मई 2026
घंटों की डेटा एंट्री
बस कुछ सेकंड में
1 फ़ाइल चुनी गई
फ़ाइल उपलब्ध नहीं है?
क्या आपको पता है कि आपका पैसा हर महीने कहां जाता है? ज़्यादातर लोगों का जवाब होगा — “कुछ-कुछ पता है, लेकिन exactly नहीं।” यही वो problem है जो बजट बिगाड़ती है और savings को रोकती है। अगर आप जानना चाहते हैं कि बैंक स्टेटमेंट से खर्चों को कैटेगरी वाइज एनालिसिस कैसे करें, तो यह गाइड आपके लिए है। चाहे आप एक salaried individual हों, freelancer हों, या micro-entrepreneur — अपनी हर UPI payment, NEFT transfer, EMI deduction और cash withdrawal को सही कैटेगरी में रखना आपकी financial health का पहला कदम है।
इस गाइड में हम step-by-step देखेंगे कि कैसे बैंक स्टेटमेंट से अपने खर्चों को organize और analyze किया जाए — manual तरीके से लेकर AI-based automatic tools तक।

खर्चों की कैटेगरी क्यों ज़रूरी है?
सोचिए — महीने के आखिर में account में पैसे कम दिखते हैं, लेकिन आपको याद ही नहीं कि कहां गए। यह बहुत common situation है। जब तक आप अपने खर्चों को कैटेगरी में नहीं बांटते, तब तक आपको अपनी spending habits का सही picture नहीं मिलेगा।
बजट बनाना आसान होता है
जब आपको पता हो कि groceries पर कितना जा रहा है, transportation पर कितना, और entertainment पर कितना — तो budget बनाना बहुत आसान हो जाता है। आप clearly देख सकते हैं कि किस area में cut करना है।
Tax filing (ITR) और GST में मदद
अगर आप freelancer हैं या small business चलाते हैं, तो ITR filing और GST compliance के लिए आपको अपने business expenses को properly categorize करना ज़रूरी है। Income Tax Act के तहत कई expenses deductible हैं — जैसे internet bill, software subscription, travel — लेकिन तभी जब आपके पास organized records हों। Presumptive taxation (Section 44ADA) में भी अगर turnover ₹50 लाख से कम है तो 50% income को profit मानकर tax लगता है, लेकिन actual method चुनने पर proper expense records चाहिए।
Savings identify करना
कैटेगरी वाइज analysis से आप तुरंत देख सकते हैं कि कहां unnecessary spending हो रही है। क्या food delivery पर बहुत ज़्यादा खर्च हो रहा है? क्या subscriptions भूल गए हैं जो अभी भी charge हो रहे हैं?
यहां एक typical Indian household की spending categories देखिए:
| कैटेगरी | Examples | औसत हिस्सा (Urban) |
|---|---|---|
| किराया / Housing | Rent, society maintenance | ~7-10% |
| खाना-पीना / Groceries | Kirana, vegetables, milk | ~25-30% |
| EMI / Loans | Home loan, car loan, personal loan | ~15-20% |
| UPI Payments | Swiggy, Zomato, Amazon, Flipkart | ~10-15% |
| Transportation | Petrol, Ola, Uber, Metro | ~7-8% |
| Medical / Health | Pharmacy, doctor, insurance premium | ~5-7% |
| Education | School fees, coaching, books | ~5-8% |
| Entertainment | Netflix, Hotstar, movies, dining out | ~3-5% |
| Subscriptions | SaaS tools, gym, magazines | ~2-3% |
| Savings / Investment | SIP, FD, PPF, NPS | ~10-15% |
बैंक स्टेटमेंट में ट्रांजैक्शन कैसे दिखते हैं
बैंक स्टेटमेंट एक PDF या Excel file होती है जिसमें आपके हर transaction का record होता है। लेकिन problem यह है कि bank transactions की descriptions बहुत confusing होती हैं। आइए समझते हैं कि different transaction types कैसे दिखते हैं।
UPI Transactions
UPI India का सबसे popular payment method बन चुका है। भारत में हर महीने 20 billion से ज़्यादा UPI transactions होते हैं। बैंक स्टेटमेंट में UPI transaction कुछ ऐसे दिखता है:
UPI/435678901234/SWIGGY/swiggy@axisbank/AXIS BANK
UPI/DR/987654321098/PhonePe/merchant@ybl
UPI/CR/123456789012/GOOGLE PAY/name@okicici
इसमें UPI reference number, merchant name, और VPA (Virtual Payment Address) होता है। Challenge यह है कि हर bank इसे अलग format में दिखाता है।
NEFT / IMPS / RTGS Transfers
NEFT/N123456789/RENT PAYMENT/MR SHARMA
IMPS/412345678901/9876543210/HDFC
RTGS/CORPORATE SALARY/COMPANY NAME
इन transfers में reference number, beneficiary name, और कभी-कभी purpose भी mentioned होता है। Salary credits अक्सर NEFT या RTGS से आते हैं।
EMI और Auto-Debit
EMI/HDFC HOME LOAN/LN123456789
NACH/INSURANCE PREMIUM/POLICY NO 12345
SI/MUTUAL FUND SIP/FOLIO 12345678
EMI deductions usually एक fixed amount होती हैं और हर महीने same date पर debit होती हैं। इन्हें identify करना relatively आसान है।
ATM Withdrawal और Cash
ATM/CASH WDL/S1AB1234/MUMBAI
ATM/NFS/WITHDRAWAL/LOC:DELHI
Cash withdrawals सबसे मुश्किल होते हैं categorize करने के लिए क्योंकि bank को पता ही नहीं होता कि cash कहां खर्च हुआ।
मैन्युअल तरीके से कैटेगरी बनाना
अगर आप Excel या Google Sheets से comfortable हैं, तो manual categorization एक अच्छी शुरुआत है।
Step 1: बैंक स्टेटमेंट डाउनलोड करें
अपने bank की net banking या mobile app से statement download करें। ज़्यादातर banks PDF और CSV दोनों format में statement देते हैं। CSV format बेहतर है Excel में काम करने के लिए।
Step 2: Data को Excel में Import करें
अगर PDF format में है, तो पहले data को Excel में convert करें। PDF से directly copy-paste करने में dates और amounts गड़बड़ हो सकते हैं — columns shift हो जाते हैं और numbers merge हो जाते हैं।
Step 3: कैटेगरी Column बनाएं
अपनी sheet में एक नया column “Category” add करें। हर transaction को manually देखकर सही category assign करें:
- UPI/SWIGGY → Food Delivery
- NEFT/RENT → Housing
- EMI/HOME LOAN → Loan EMI
- ATM/CASH WDL → Cash (Uncategorized)
Step 4: Pivot Table बनाएं
सब categorize करने के बाद Pivot Table बनाकर summary देखें — कौन-सी category में कितना खर्च हुआ।
Manual Method की Limitations
- Time consuming — 100 transactions categorize करने में 1-2 घंटे लगते हैं
- Error-prone — थकान में गलत category assign हो जाती है
- Repetitive — हर महीने same काम दोबारा करना पड़ता है
- PDF parsing issues — PDF से data accurately निकालना मुश्किल है
हर महीने Excel में घंटों खर्च ट्रैक करना थक गए? BankStatementLab आपके बैंक स्टेटमेंट PDF से ऑटोमैटिक कैटेगरी वाइज रिपोर्ट बनाता है। अभी आज़माएं →
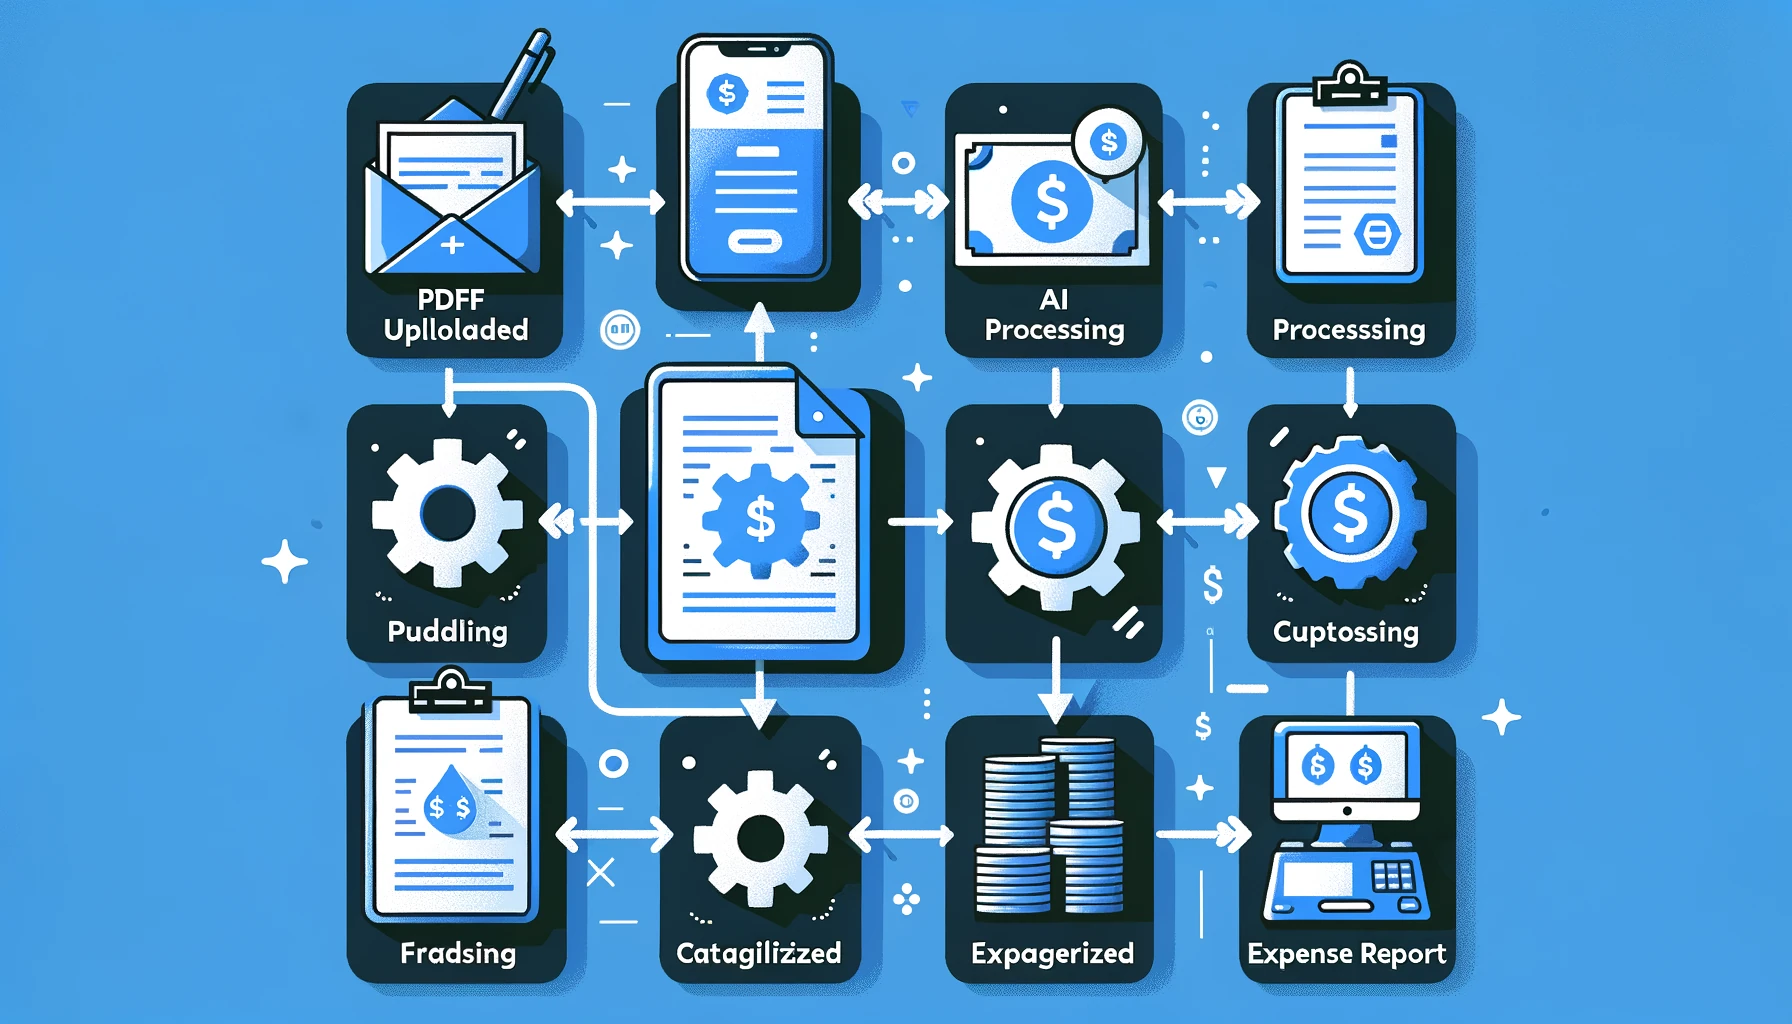
ऑटोमैटिक कैटेगोराइज़ेशन कैसे काम करता है
Manual method की limitations देखकर यह clear है कि automation ज़रूरी है। AI-powered tools बैंक स्टेटमेंट को read करके automatically transactions को सही categories में बांट सकते हैं। आइए समझते हैं कि यह technology कैसे काम करती है।
Step 1: PDF Data Extraction
सबसे पहले tool आपके बैंक स्टेटमेंट PDF को read करता है। Advanced OCR (Optical Character Recognition) और AI models PDF के complex layouts को समझकर date, description, debit/credit amount सही-सही extract करते हैं। यह किसी भी bank के statement format के साथ काम करता है।
Step 2: Transaction Description Analysis
Extract हुए data में हर transaction की description को AI analyze करता है। यह keywords, patterns, और context को देखकर समझता है:
- “UPI/SWIGGY” → Food Delivery
- “NEFT/RENT PAYMENT” → Housing
- “NACH/LIC PREMIUM” → Insurance
- “POS/APOLLO PHARMACY” → Medical
Step 3: Smart Categorization
AI model सिर्फ keywords नहीं देखता — यह amount, frequency, और transaction pattern भी consider करता है:
- हर महीने same date पर same amount = EMI या subscription
- Small frequent UPI payments = Daily expenses
- Large one-time NEFT = Rent या major purchase
Step 4: Review और Export
Categorized data आपको एक clean report में मिलता है जिसे आप Excel, CSV, या directly अपने accounting software में import कर सकते हैं।
कैटेगरी वाइज एनालिसिस से क्या-क्या फ़ायदे मिलते हैं
सिर्फ categorize करना काफी नहीं है — असली power तब आती है जब आप इस data को analyze करते हैं। यहां देखिए कि categorized data कैसे आपकी financial life बदल सकता है।
बजट की Reality Check
ज़्यादातर लोग सोचते हैं कि वो ₹5,000 महीने food delivery पर खर्च करते हैं, लेकिन actual figure ₹12,000 निकलती है। Categorization आपको reality दिखाती है।
Month-on-Month Comparison
जब हर महीने का data categorized हो, तो आप trends देख सकते हैं। क्या groceries का खर्च बढ़ रहा है? क्या entertainment spend control में है?
Goal Setting
अगर आपको पता है कि transportation पर ₹8,000 जा रहे हैं, तो आप target set कर सकते हैं — “अगले महीने ₹6,000 में manage करूंगा।“
Before-After Comparison
यहां देखिए कि categorization से पहले और बाद में financial awareness कैसे बदलती है:
| Parameter | बिना कैटेगोराइज़ेशन | कैटेगोराइज़ेशन के बाद |
|---|---|---|
| खर्च का awareness | ”कहीं चला गया” | हर ₹ की tracking |
| Budget accuracy | ±40-50% off | ±5-10% accurate |
| Unnecessary expenses | पता ही नहीं चलते | तुरंत identify होते हैं |
| Tax filing time | 2-3 दिन (documents खोजना) | 2-3 घंटे (सब organized) |
| Financial decisions | Gut feeling पर | Data-driven |
| Monthly savings | Random | Planned और consistent |
| Loan eligibility | Unclear picture | Clear cash flow proof |
Freelancers और Small Business के लिए Extra Benefits
- GST Input Credit — Properly categorized expenses से आप eligible input tax credit claim कर सकते हैं
- ITR Filing — Business expenses (internet, software, co-working space) को easily deductions में दिखा सकते हैं
- Cash Flow Management — Client payments vs. expenses का clear picture मिलता है
- Investor या Loan Application — Organized financials से credibility बढ़ती है
5 गलतियां जो खर्च ट्रैकिंग में लोग करते हैं
कैटेगोराइज़ेशन शुरू करना अच्छी बात है, लेकिन कुछ common mistakes से बचना ज़रूरी है।
1. Cash Withdrawals को Ignore करना
ATM से ₹10,000 निकाले और सब “Cash” में डाल दिया — यह सबसे बड़ी गलती है। Cash spending को भी track करने की कोशिश करें। कम से कम बड़ी cash purchases को note करें।
Solution: ATM withdrawal के बाद तुरंत phone में note करें कि कहां खर्च किया। या ज़्यादा से ज़्यादा UPI use करें ताकि digital trail बने।
2. बहुत ज़्यादा Categories बनाना
“Groceries,” “Vegetables,” “Fruits,” “Dairy,” “Snacks” — इतनी granular categories बनाने से analysis complicated हो जाता है और consistency maintain करना मुश्किल होता है।
Solution: 10-15 main categories रखें। ज़रूरत हो तो sub-categories बनाएं, लेकिन top-level analysis के लिए broad categories use करें।
3. Internal Transfers को Expense मानना
जब आप एक account से दूसरे account में पैसे transfer करते हैं — savings account में, FD में, या family member को — तो ये actual expenses नहीं हैं। इन्हें expense categories में count करने से total spending inflate हो जाती है।
Solution: “Transfer” या “Internal” नाम की एक अलग category बनाएं और इन्हें expense analysis से exclude करें।
4. सिर्फ एक महीने का Data देखना
एक महीने का data misleading हो सकता है। शादी attend की, festival था, या medical emergency आई — किसी एक महीने को normal month नहीं मान सकते।
Solution: कम से कम 3-6 महीने का data categorize करके average निकालें। तभी realistic budget बनेगा।
5. Set और Forget करना
एक बार categories बना लीं और फिर कभी review नहीं किया। नए vendors आते हैं, spending patterns बदलते हैं, नई subscriptions शुरू होती हैं।
Solution: हर month-end पर 15-20 minutes लगाकर categories review करें। नए transactions check करें कि सही category में गए हैं या नहीं।
निष्कर्ष
अपने बैंक स्टेटमेंट से खर्चों की कैटेगरी वाइज एनालिसिस करना कोई complicated काम नहीं है — बस सही approach और tools चाहिए। चाहे आप manually Excel में शुरू करें या AI-powered tool use करें, important यह है कि आप शुरू करें।
आइए quick recap करते हैं:
- कैटेगोराइज़ेशन ज़रूरी है — बजट, savings, tax filing सब के लिए
- बैंक स्टेटमेंट में UPI, NEFT, EMI सब different formats में दिखते हैं — इन्हें समझना पहला step है
- Manual method काम करती है लेकिन time-consuming है
- Automatic tools जैसे BankStatementLab घंटों का काम मिनटों में करते हैं
- Common mistakes avoid करें — जैसे cash ignore करना, बहुत ज़्यादा categories बनाना, और transfers को expenses मानना
अपनी financial journey आज से शुरू करें। पहले महीने का statement download करें, categories बनाएं, और देखें कि आपका पैसा actually कहां जा रहा है। Results आपको surprise करेंगे।
अपने बैंक स्टेटमेंट को instantly categorized report में बदलें। BankStatementLab में बस PDF upload करें और AI automatically सब transactions को categories में बांट देगा — UPI, NEFT, EMI सब कुछ। अभी शुरू करें →
अपनी अकाउंटिंग को ऑटोमेट करने के लिए तैयार हैं?
हजारों प्रोफेशनल्स के साथ जुड़ें जो हर महीने घंटों बचाते हैं।